InfraHub
Designing Google Maps for road maintenance.
Built for the U.S. state agencies that maintain public roads. It started as a single-screen freelance brief, became a demo for a startup accelerator, and grew into the product they use today.
4→1
Four disconnected tools became one product on a map
10screens
screens — All shipped and live, county map to state dashboard
YC '23
Earned a Y Combinator interview, though InfraHub didn't get in
Overview
Helping road agencies plan years of maintenance on one map.
InfraHub is software for the state agencies that maintain public roads, the Departments of Transportation, or DOTs. It helps them plan maintenance across a budget set years ahead. Everything they look after counts as an asset, from the road surface to the signs and guardrails along it.
Engineering built the product from my Figma, and I was the only designer across all three phases. It is live at infrahub.com, and I built the figures here in code, with help from AI. The demos run as real interfaces, played on scroll.
The arc
Phase 1 · 2023
Prototype
One-screen brief → YC demo
Phase 2 · 2024
Production rebuild
Live app, shipped
Phase 3 · 2024–25
Multi-year planning
Year board + budget forecast, shipped
Problem
DOTs run road maintenance on notepads, Excel, and email.
InfraHub's cofounder and CEO laid it out in an early brief:
"The typical DOT today has limited to no information on their assets, uses notepads and static excel files to plan their work, executes the work via email/text/phone calls, and has effectively 0 reporting capability."
That's four separate jobs: understanding what you have, scheduling and budgeting the work, forecasting what that budget buys, and reporting on it. They were spread across notepads, spreadsheets and email, and reporting barely happened. InfraHub puts them in one place, on a map.
What grounded it
Four things were settled before I drew a screen.
The CEO had worked with a state Department of Transportation as a consultant, so he knew how its planners worked: who spots a problem, who schedules the fix, and how far ahead the budget is set.
Findings → decisions
Real DOT users at the CEO's consulting client already liked a road-condition map.
Bet the whole product on the map.
The person who spots a problem is the one who schedules the repair.
Create a job from any road or asset.
The CEO made office staff the main user over field crews, on a guess.
Every screen designed for a desktop.
Agencies commit budgets years ahead, so one-year plans never matched how they work.
Planning had to span multiple years.
He was still consulting for that DOT, so he showed the screens to users there and reported back. They liked the condition map and said they'd use it to group jobs by area. He and his cofounder also took it to trade exhibitions, with banners and cards I designed.
How it works
The map works one county at a time, three levels deep.
A county is the area a single planner is responsible for. The map goes three levels deep: the county, the streets in it, and the detail of any one road.
The four parts
Phase 1 · 2023
Three decisions from the first version that stuck.
InfraHub's CEO already had a working tool, and he hired me through Upwork to redesign it, one contract at a time for the whole project.
"Pretty average design, so I'd like to improve a lot here (particularly on the UX, how things flow together)."
My prototype carried his pitch into an interview at Y Combinator, the startup accelerator; he didn't get in, and he went full-time two months later.
County View
The 2023 tool, and the V1 redesign.
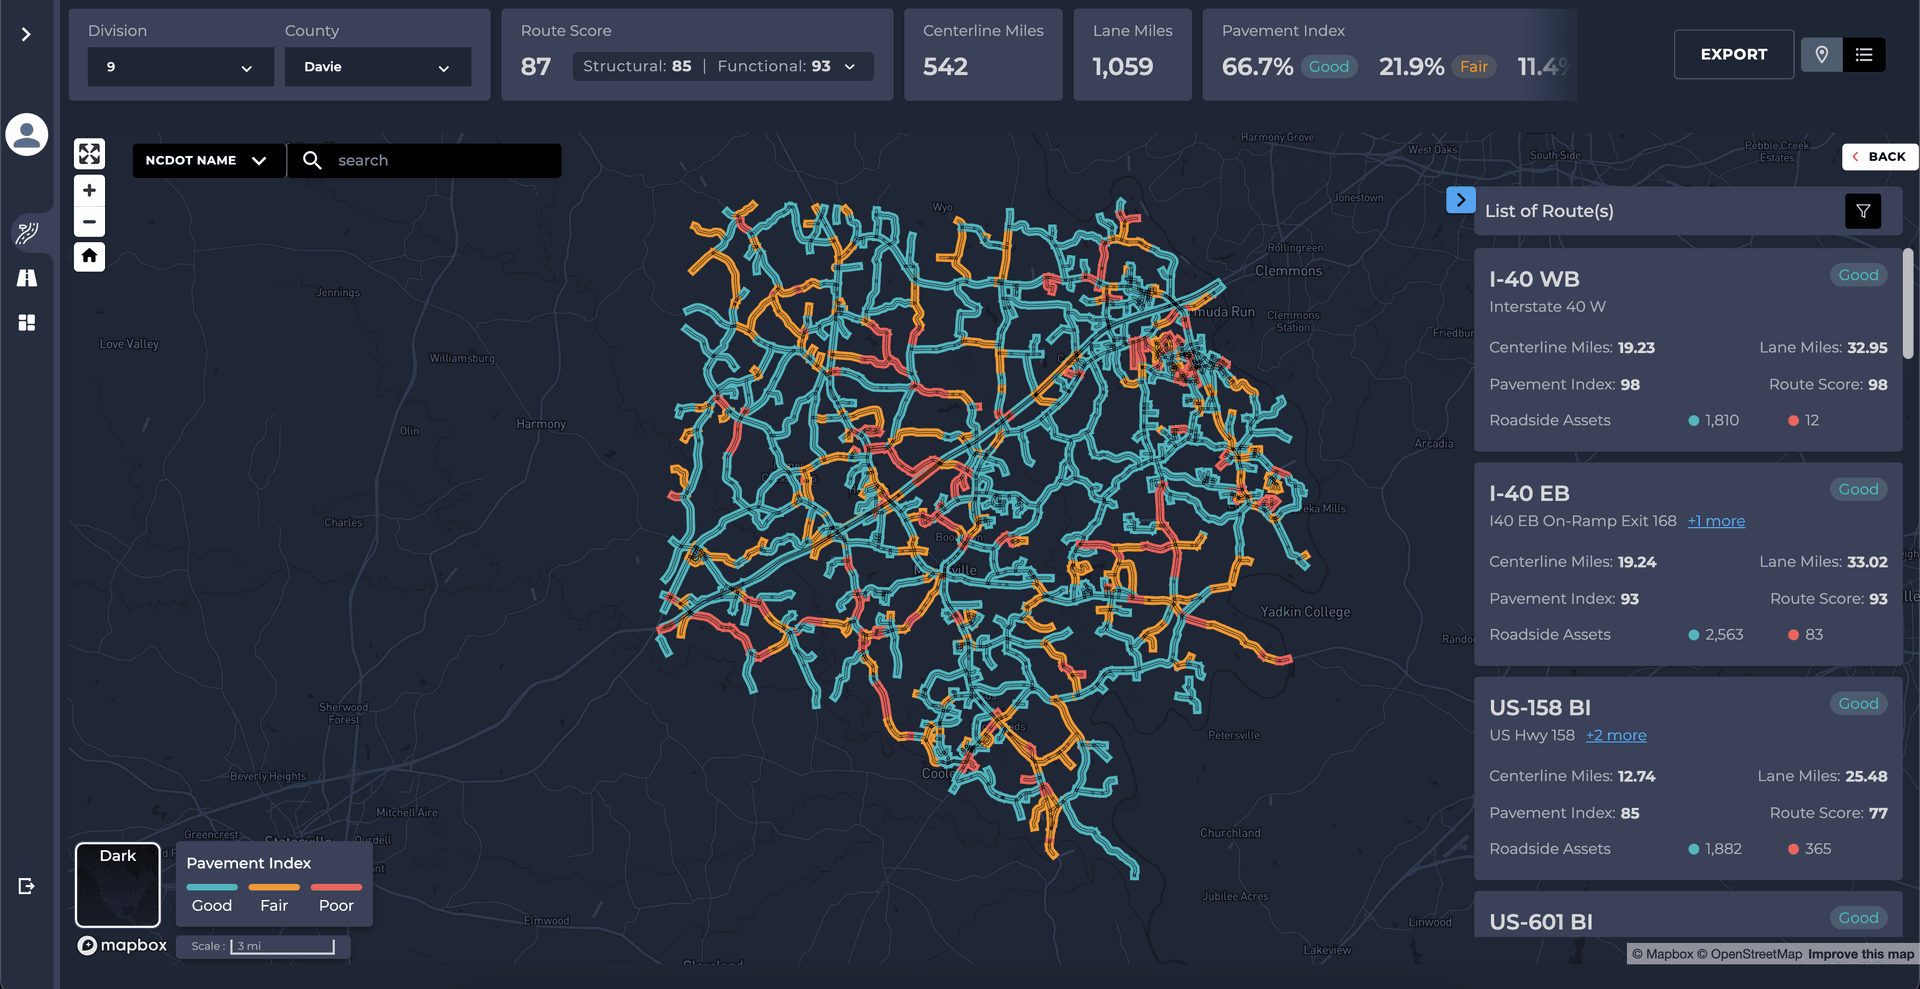
- Eight numbers and two dropdowns. The Poor share is cut off.
- Six numbers a card, so only three fit.
- Good roads are teal, not green.
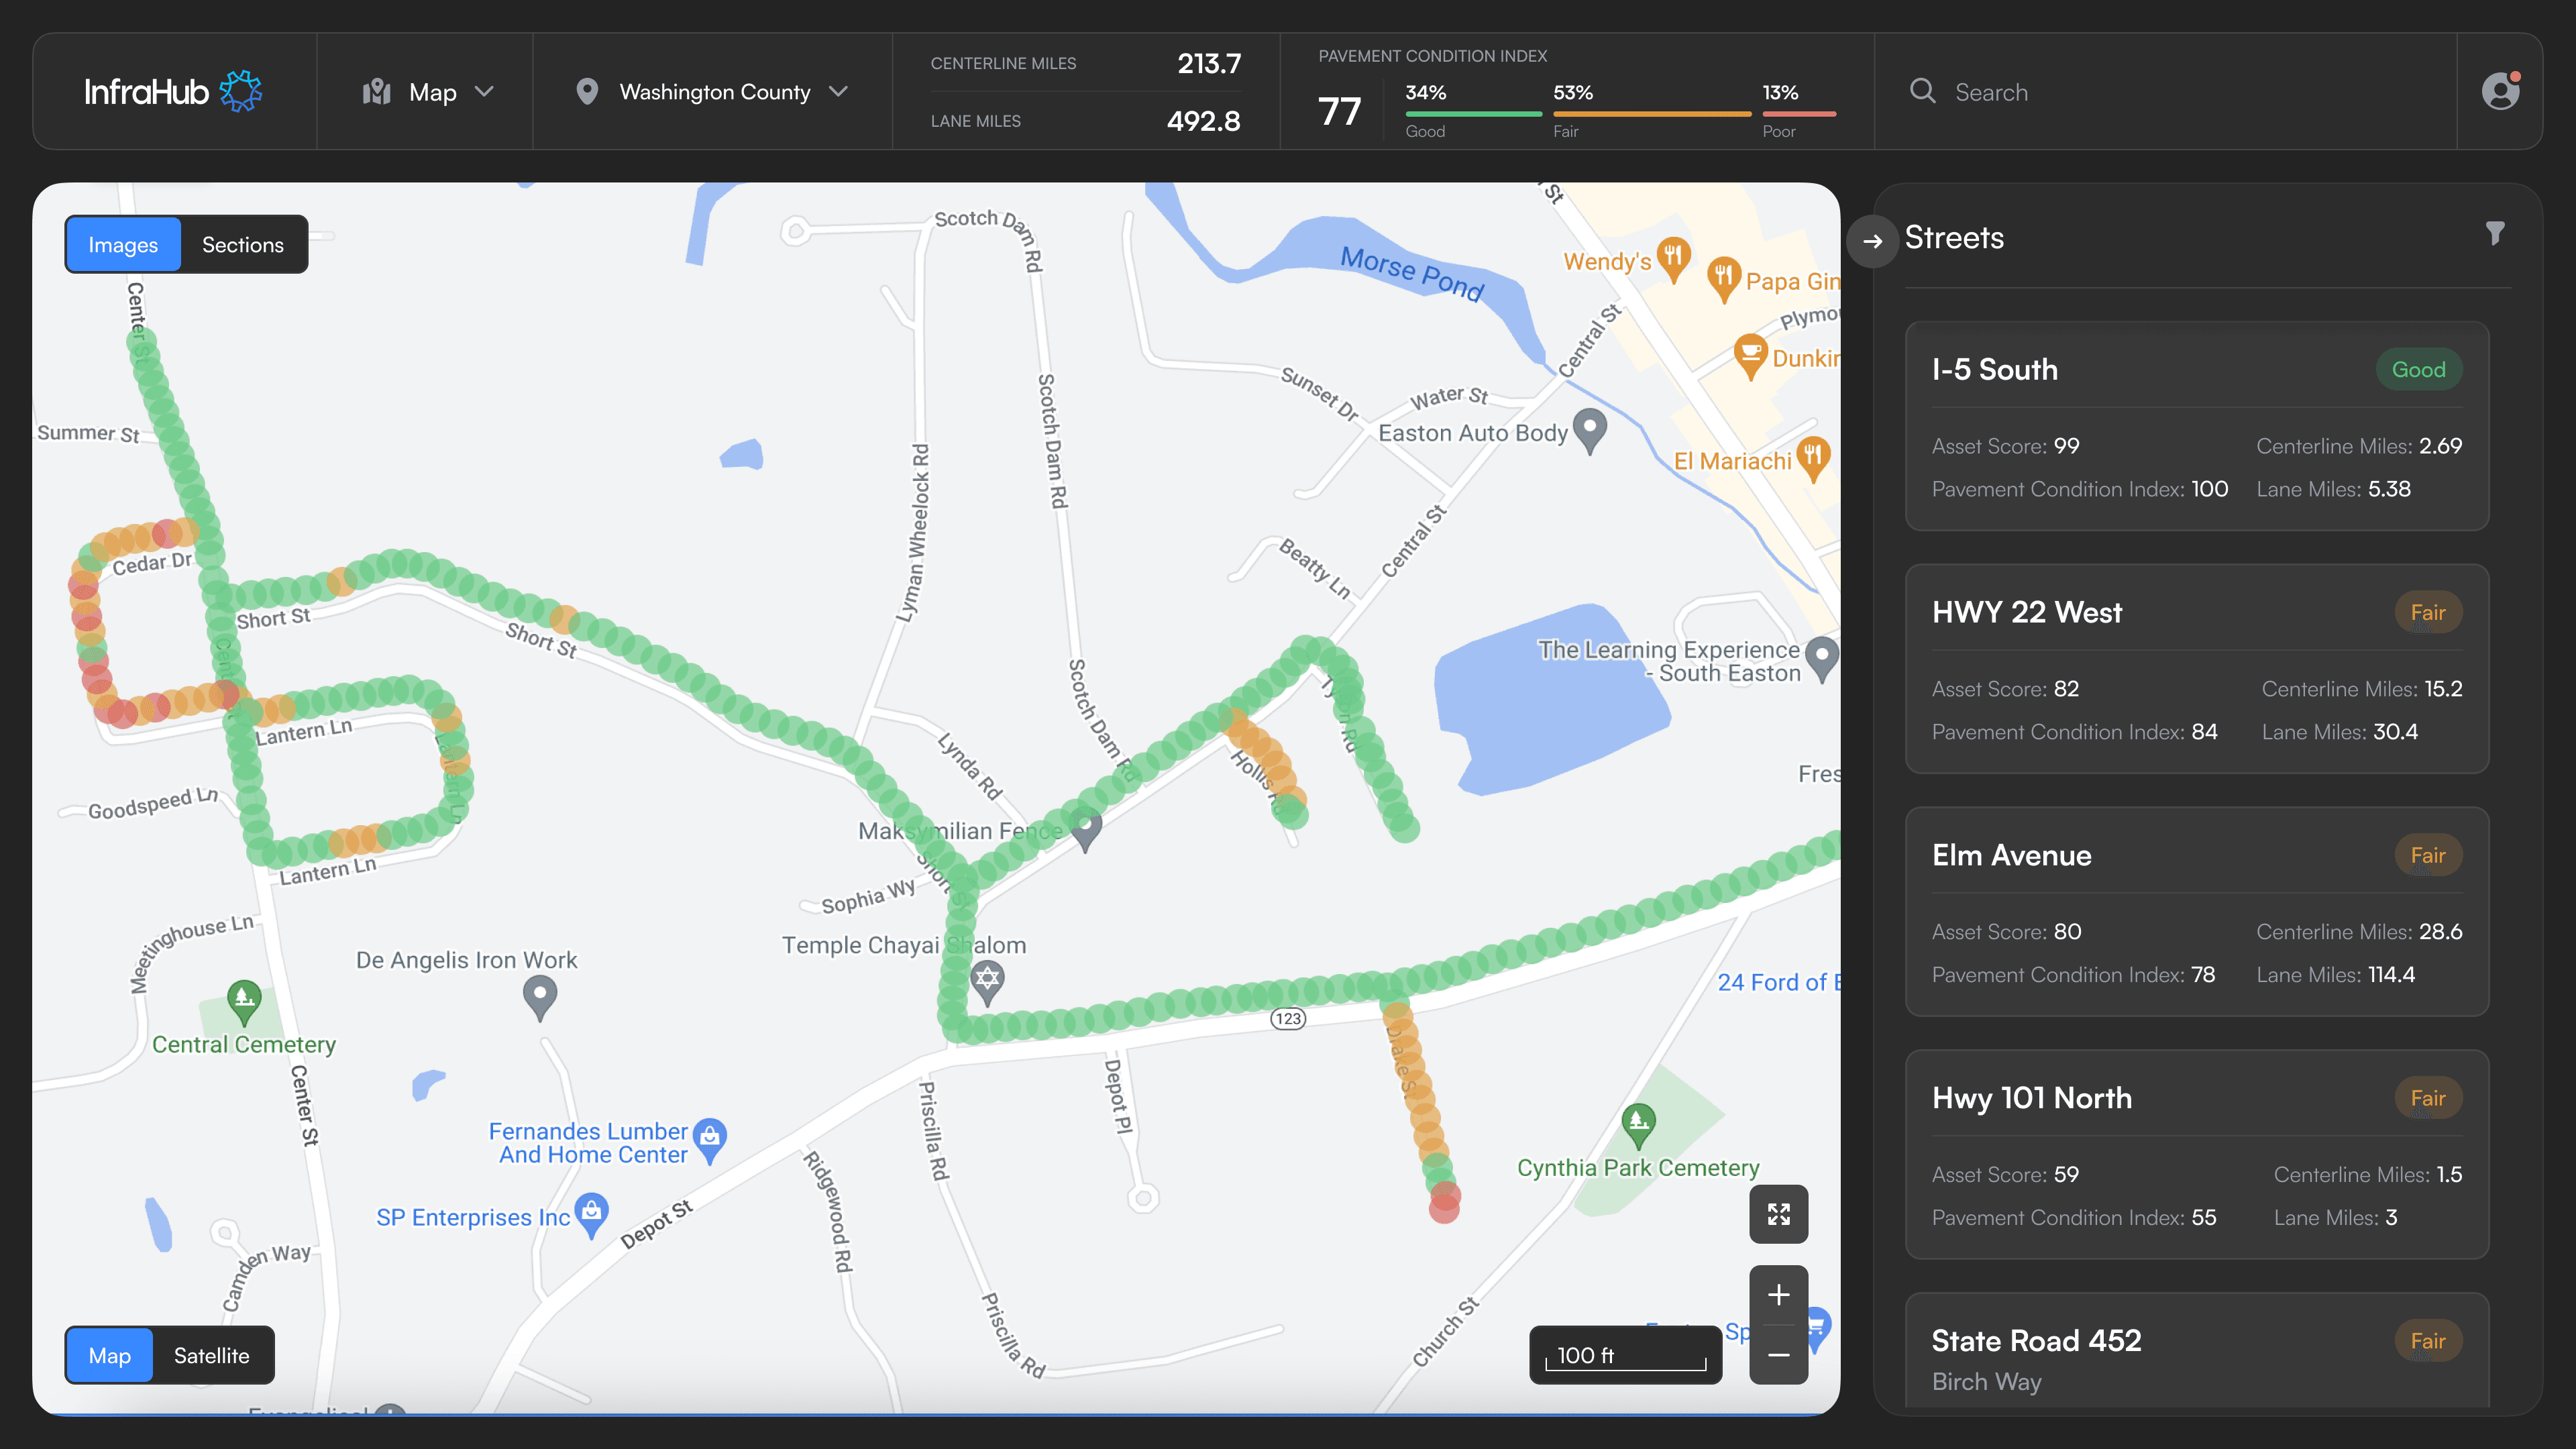
- Three groups: county, miles and PCI.
- One panel lists the streets and opens a road in place.
- Good, fair and poor in green, amber and red.
One plan was enough to ship.
My first sketch stacked several plans over a shared backlog, the pool of jobs nobody has scheduled yet. The CEO asked for one, and the DOT users he was showing it to ran one plan at a time. So we cut the stack to one plan, and years arrived later as columns inside it.
Every colour had to mean something.
The CEO wanted the interface clean, but colouring every road by condition let his client's users spot the failing ones at a glance. Green and red are also the two a colour-blind reader can't tell apart, so in the panels every condition colour has its word beside it. That held through every phase.
The colour rule
Color = condition
Everything else = grayscale
No icon kit covers DOT assets.
With one generic pin for every asset, a planner couldn't tell a sign from a guardrail on the map. No single library covers all nineteen road asset types, so I took the icons that existed and drew the rest myself, from signs and guardrails to curbs and crossings.
The asset system
Point
Line
Area
Each asset is one icon. The condition color is added when it's drawn, so the same icon covers good, fair, and poor.
Phase 2 · 2024
The rebuild made the map the product.
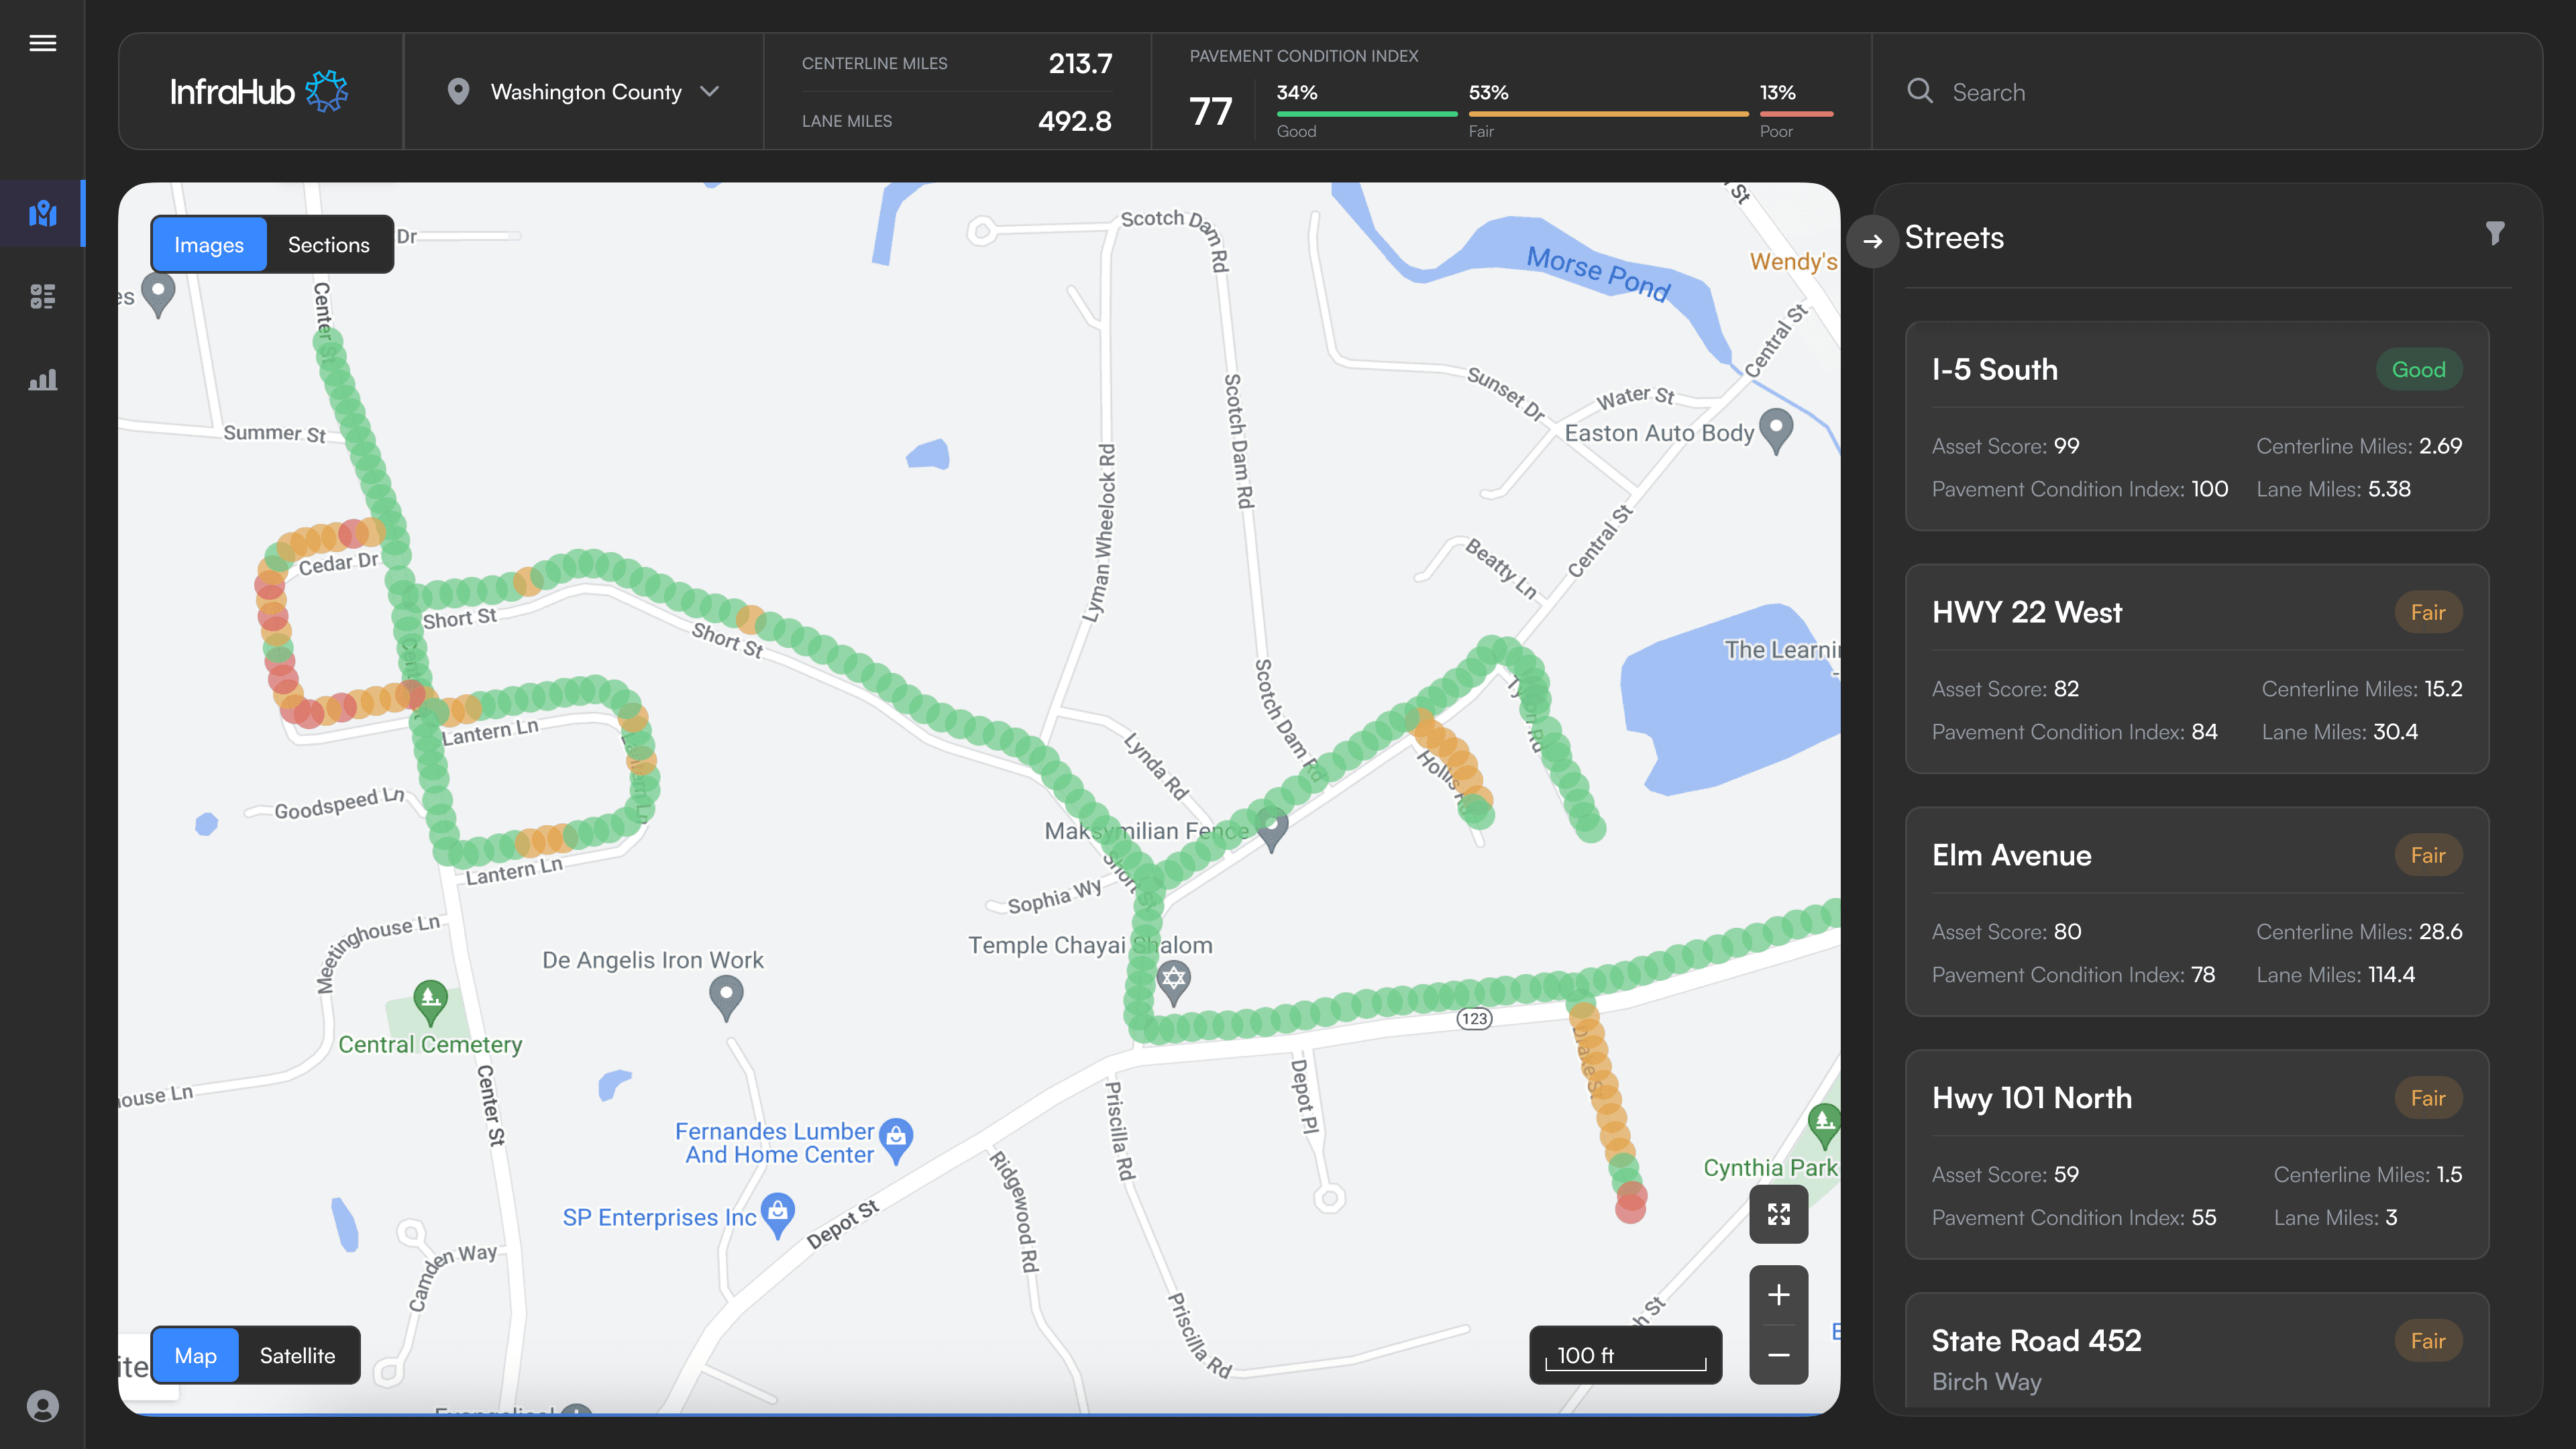
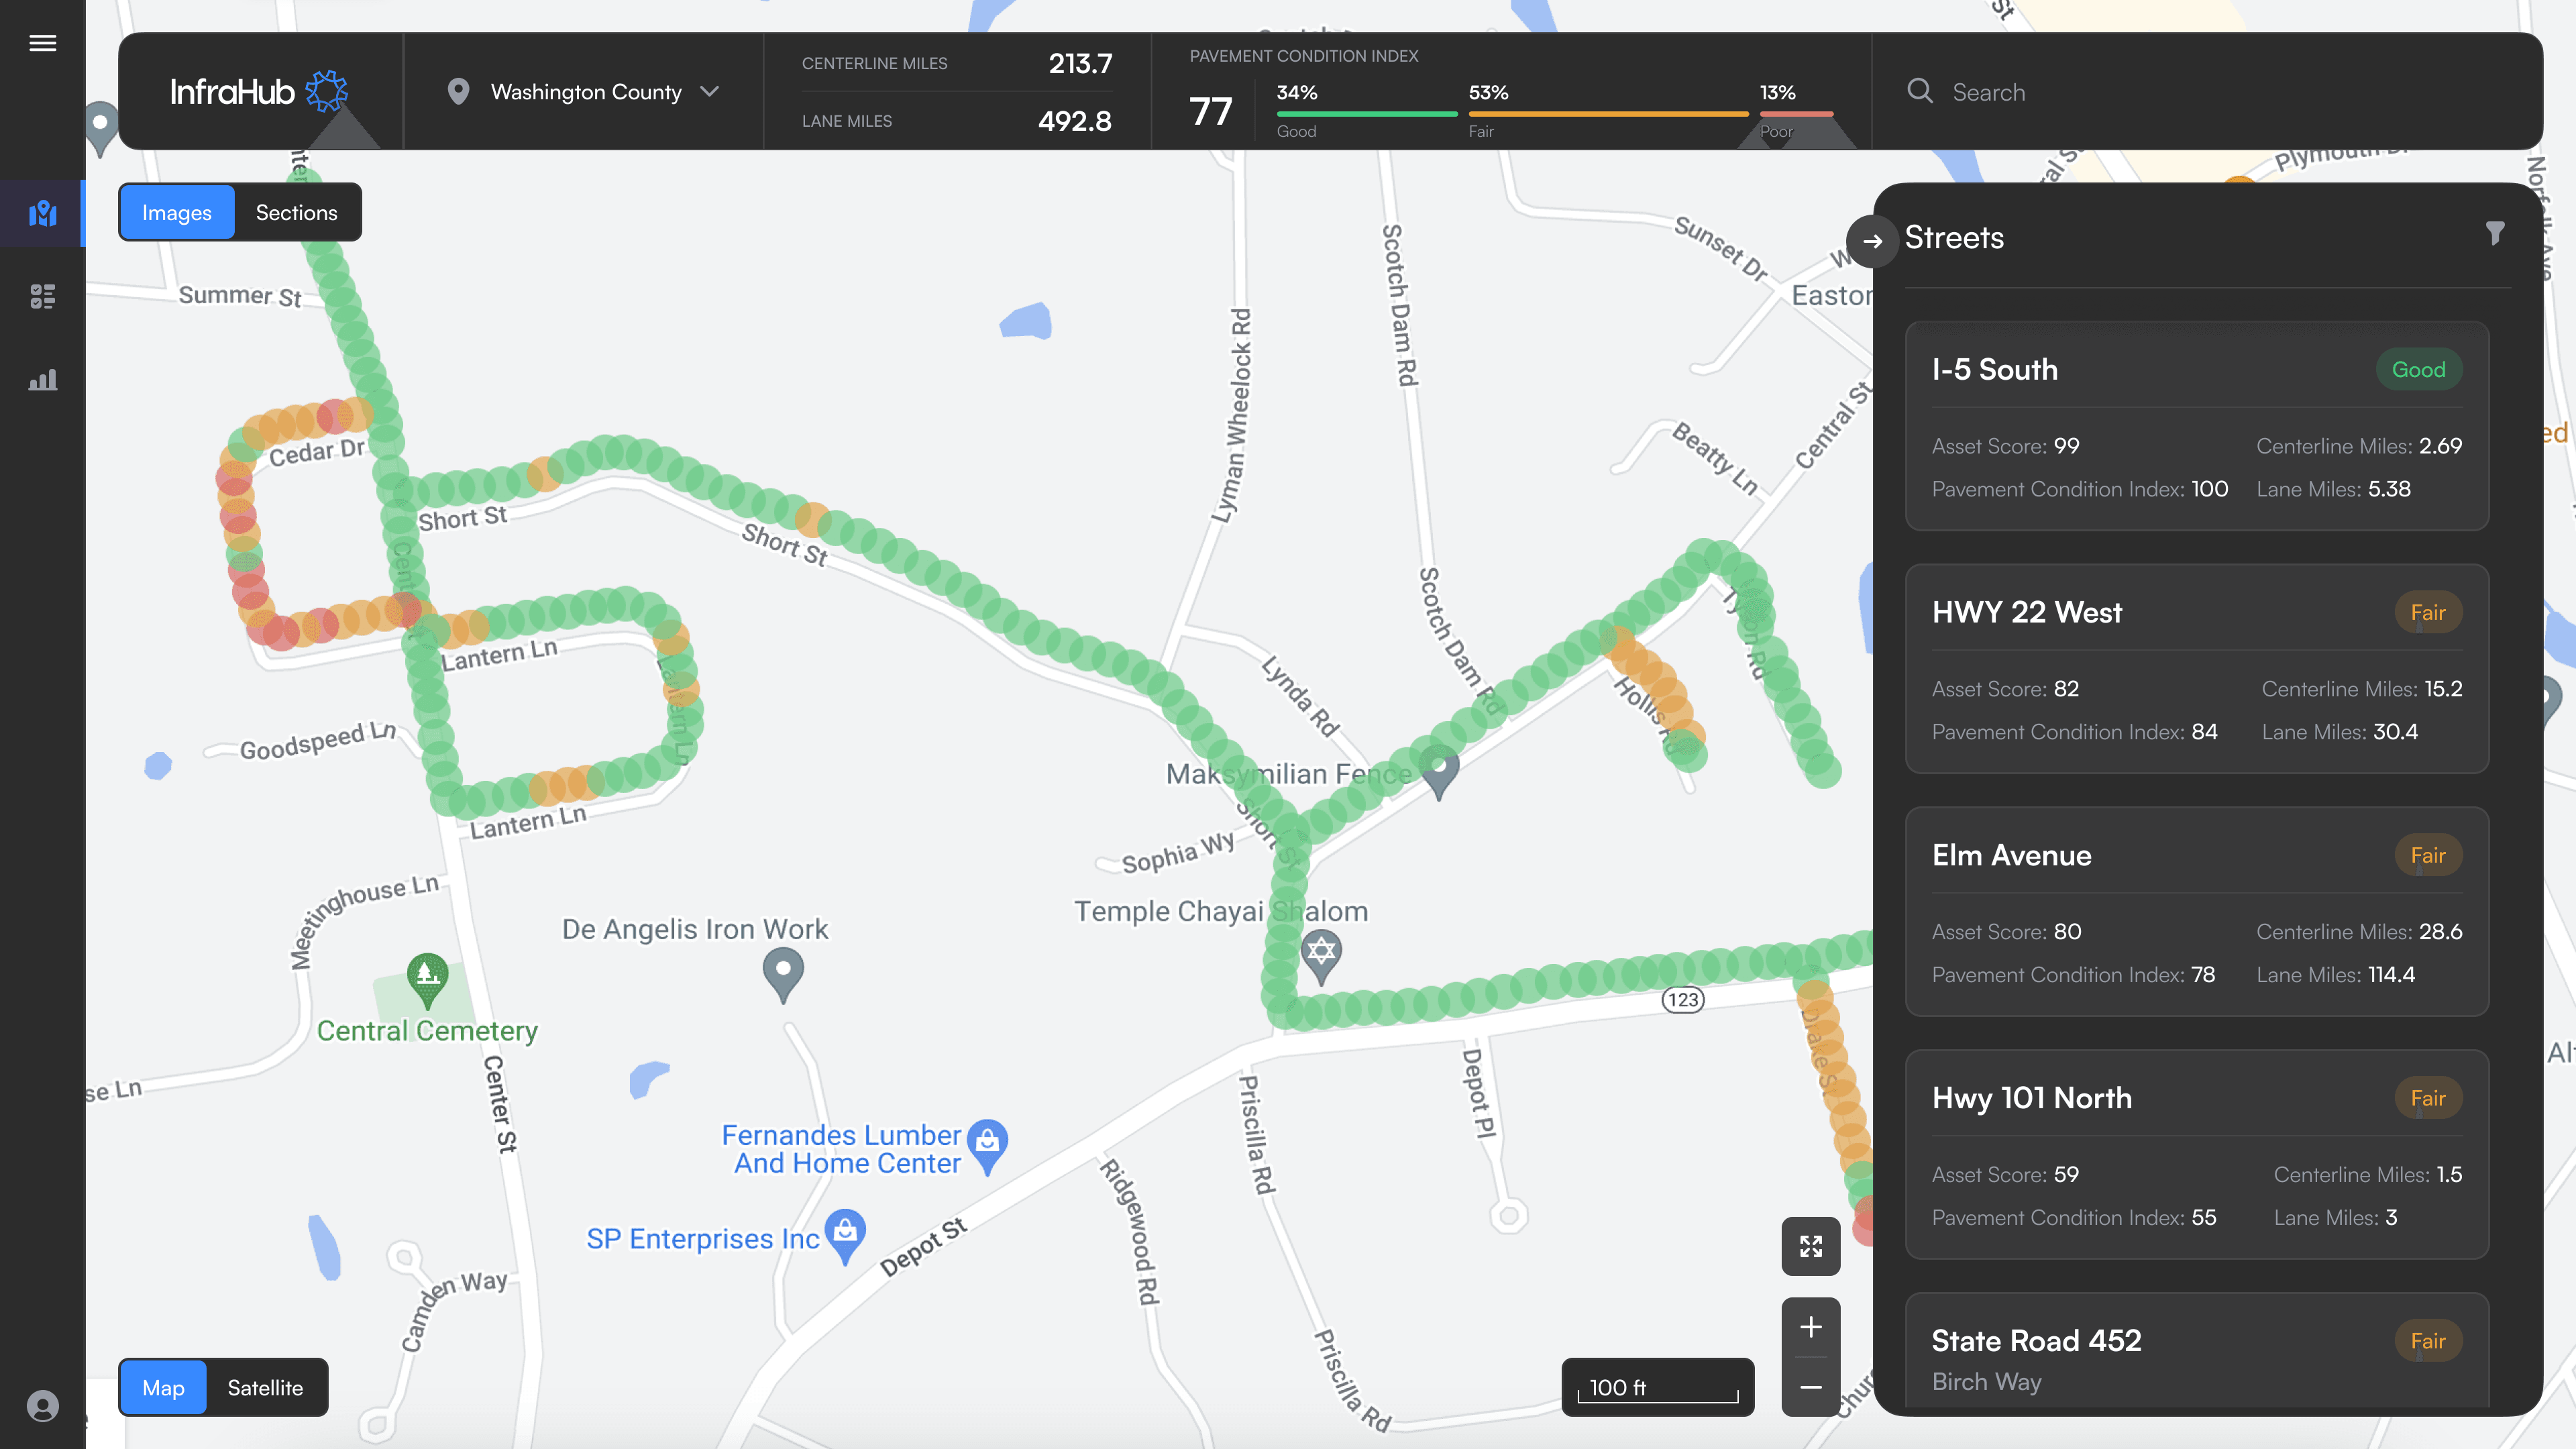
By 2024 an engineer was building from my Figma. I tried the navigation as a rail and as a top-bar menu, with the streets list docked and floating. Every version gave the map a box to share with the controls. The map is what people come for, so I made it work the way the CEO had asked from the start:
"We're basically building a ‘Google Maps’, but for a specific use case, Departments of Transportation… The goal is to enable the DOTs to see / interact with those objects in a similar way to how you can interact with restaurants and shops on Google Maps." — the CEO, in the first brief
Navigation · explored
Making room for the map.
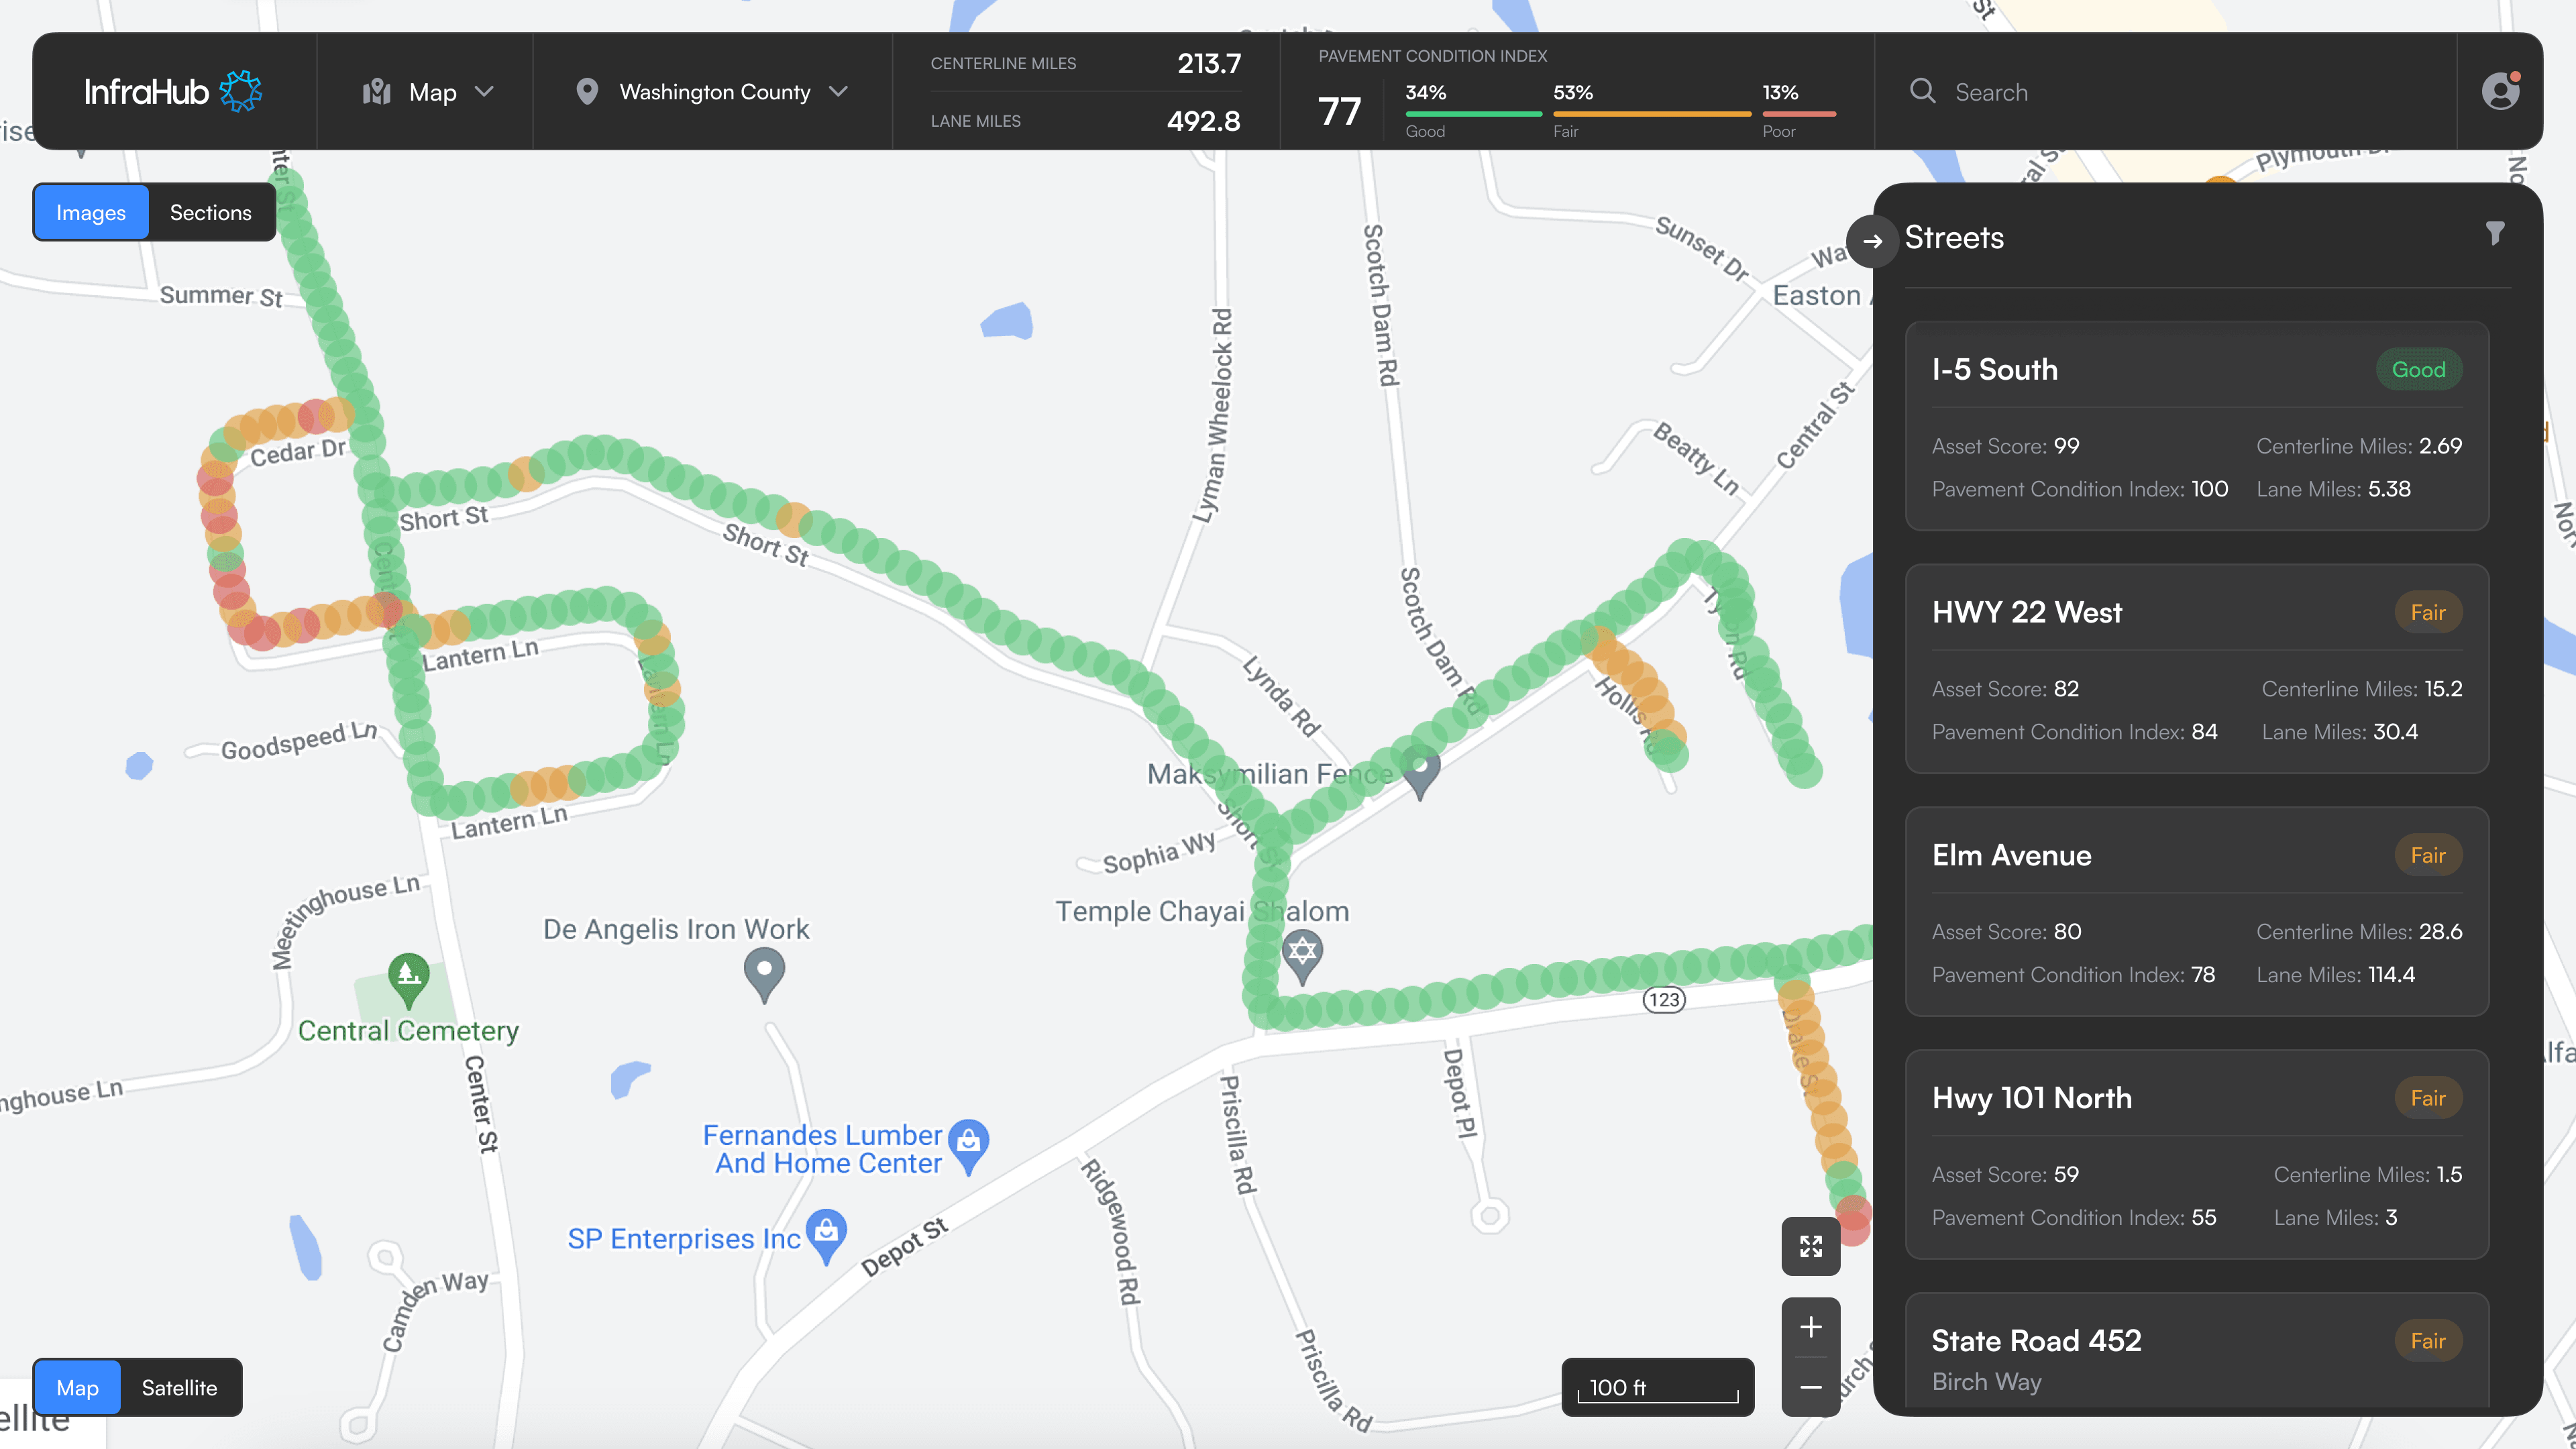
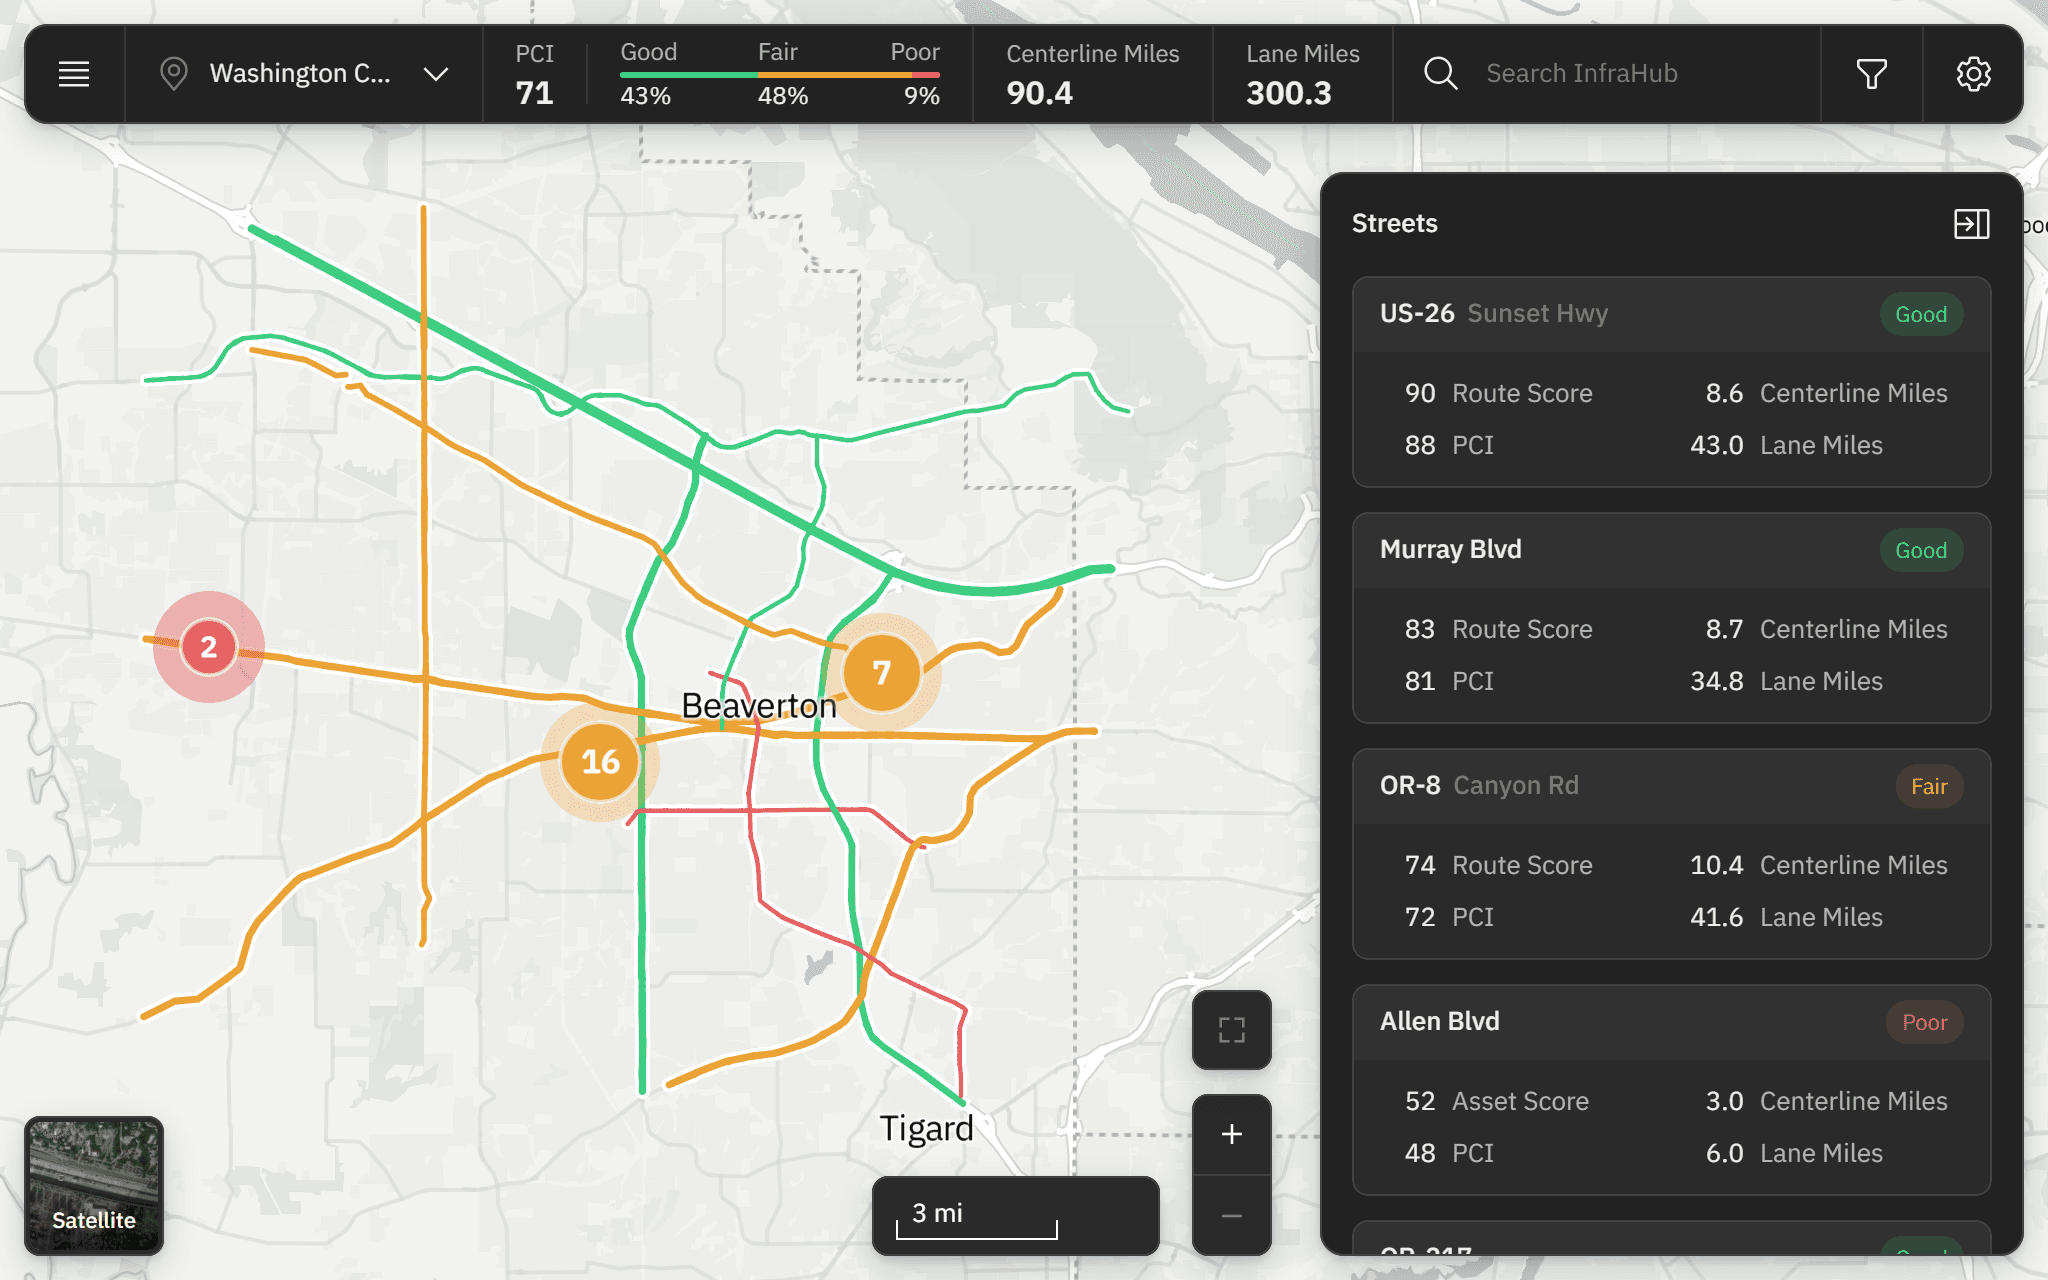
The map shows more detail the closer you zoom.
The prototype only placed point assets, but the real product also needed lines, like curbs and guardrails, that stay legible at every zoom. Showing everything at once muddied the map, so the map scales detail to the zoom.
Detail follows the zoom
Assets group into a single cluster.
The cluster splits apart.
Each asset and line pattern reads on its own.
Condition and asset type filter the map together.
The first version only filtered by pavement condition, and the rebuild added asset type. A planner looking for poor-condition guardrails needs both filters at once, so I put them in one panel.
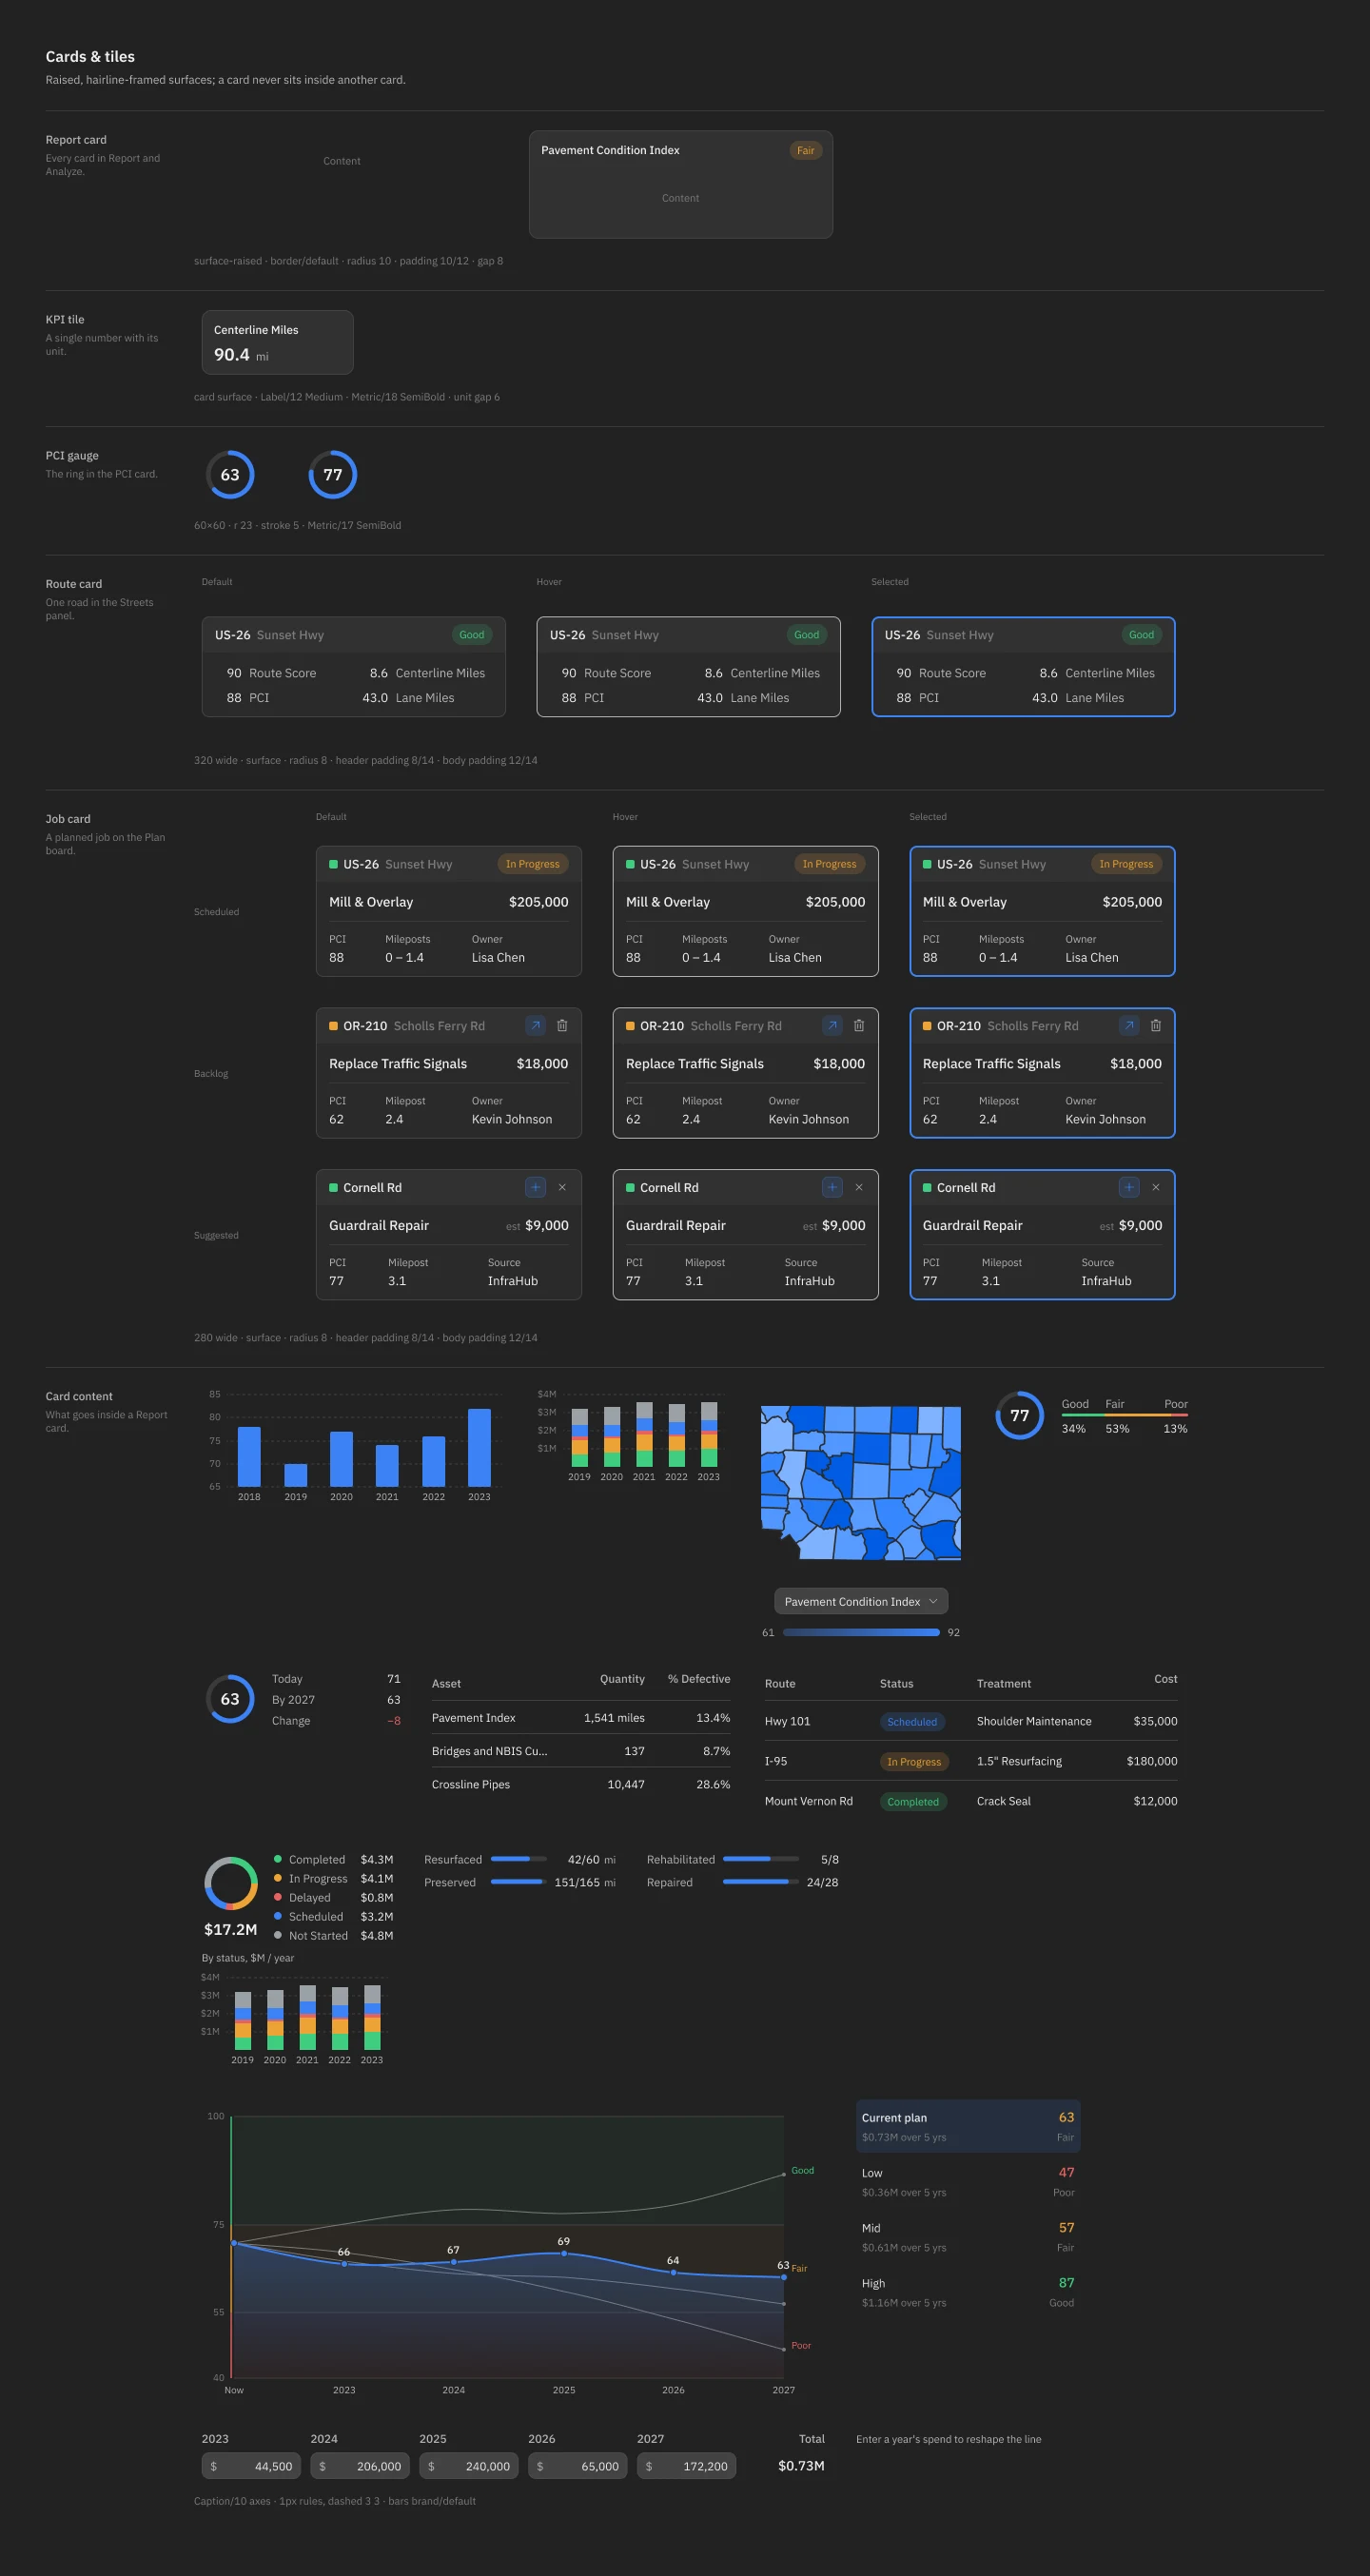
A design system to keep it consistent.
With an engineer building from my Figma, one part had to look and behave the same wherever it appeared. I built a design system for it. One job card, for example, serves both the plan and a road’s detail panel, edited in place in both.
Phase 3 · 2024–25
Planning five years ahead, with AI finding the work.
The plan already had two views, a table and a map that stay in sync.
A board for planning across years, with AI suggesting the jobs.
Users wanted five years, and DOTs commit budgets that far out, so I added a board of year columns, like Trello. The CEO wanted the AI to find the jobs worth doing across thousands of roads. I designed its suggestions as cards the planner accepts or dismisses, so the decision stays with them.
Seeing what the budget buys.
Analyze shows where the county's road condition ends up under different budgets, before any money is committed.
A dashboard for the whole network.
The state-level view goes back to the first version, which I designed from the CEO's brief in 2023. It rolls the whole network up into the few numbers a director reports on.
Outcome + reflection
All four jobs now live in one product.
Ten screens shipped across three phases, and the work is still going. An agency that ran this on spreadsheets and email can now do it in one product.
I've never used the finished product myself. The CEO put it plainly: "InfraHub is going good, we are just growing slower than expected."
What shipped.
Map View: what the county has, and what condition it's in.
Plan: which jobs happen, when, and what they cost.
Analyze: which roads a budget saves.
State-level Dashboard: how the whole state is doing.
“…understanding when to take directions and when to push back with new and better ideas.”
Cofounder & CEO, InfraHub · in his review of the work
What slipped
The build never quite matched the design.
The CEO and I were specific about all of it: spacing, type, colour, icons, states. A lot of that drifted once engineering built it. I raised it and we fixed some. Getting the product working came first, so the rest shipped as built.
What I learned.
I’d stay until the build matched the design: between contracts, designs got rewritten in code without me, and small differences shipped. Next time I’d also ask to ship the front end myself.
The CEO’s DOT experience was my best research: it settled four decisions before I drew a screen, and users at his consulting client saw the first version.
One plan first, years when users needed them: the DOT users ran one plan at a time, so designing for several would have solved a problem nobody had yet.
Credits
Designed alongside the two cofounders, with two engineers building it and a teammate working with the agencies.
Next project · 02 / 03